EA provides growth model results annually. The growth model adjusts for the specific context of your students, including prior MAP Growth score, English Language Learner Status, Special Education Status, Free/Reduced Price Lunch Status, and other student characteristics. This is commonly referred to as a value-added model.
EA’s results are generated using a regression model to estimate the effects of teachers and schools on student growth. Conceptually, this methodology can be illustrated by the following steps:
Step-by-Step Conceptual Example
Step 1: Collect Student Data and Determine Demographic Adjustments
After Spring testing is complete, EA collects student data—test and demographic data—from participating districts and determine demographic and other adjustments for the growth model.

Step 2: Create a Customized Statistical Prediction for Each Student
Each student gets a customized statistical prediction based on their characteristics. Adjustments are done for gender, race, ethnicity, English Language Learner Status, Special Education Status, and Free/Reduced Price Lunch Status.
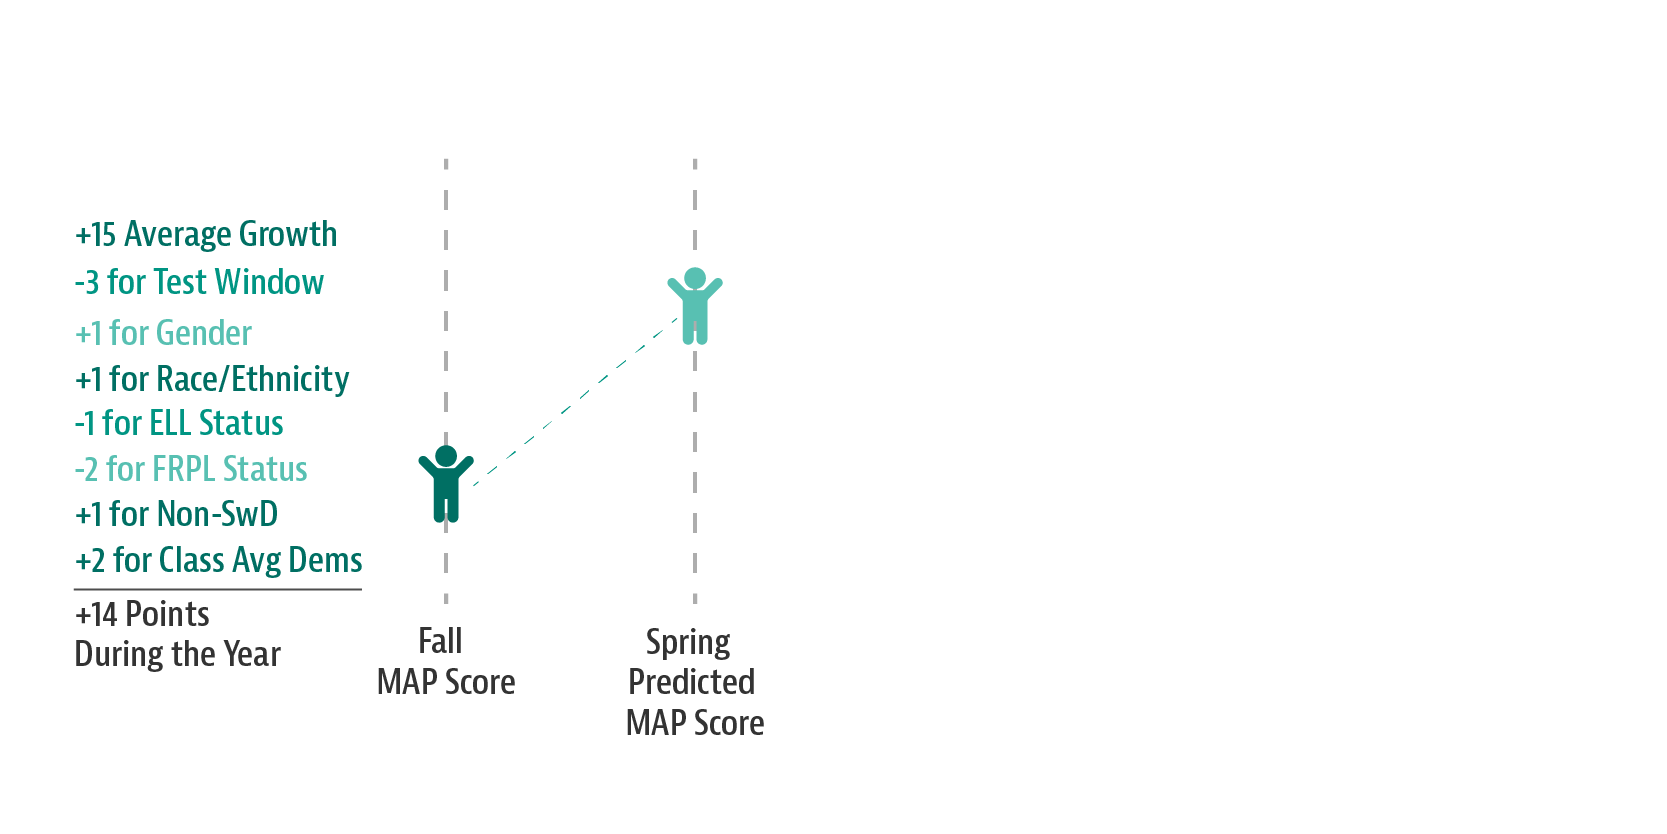
Note: the statistical predictions are based on the growth of similar students from across participating districts. The adjustments indicated here are for illustrative purposes rather than the actual adjustments that will be used. The actual adjustments are calculated each year for each grade and subject based on growth of similar students during that same time-period.
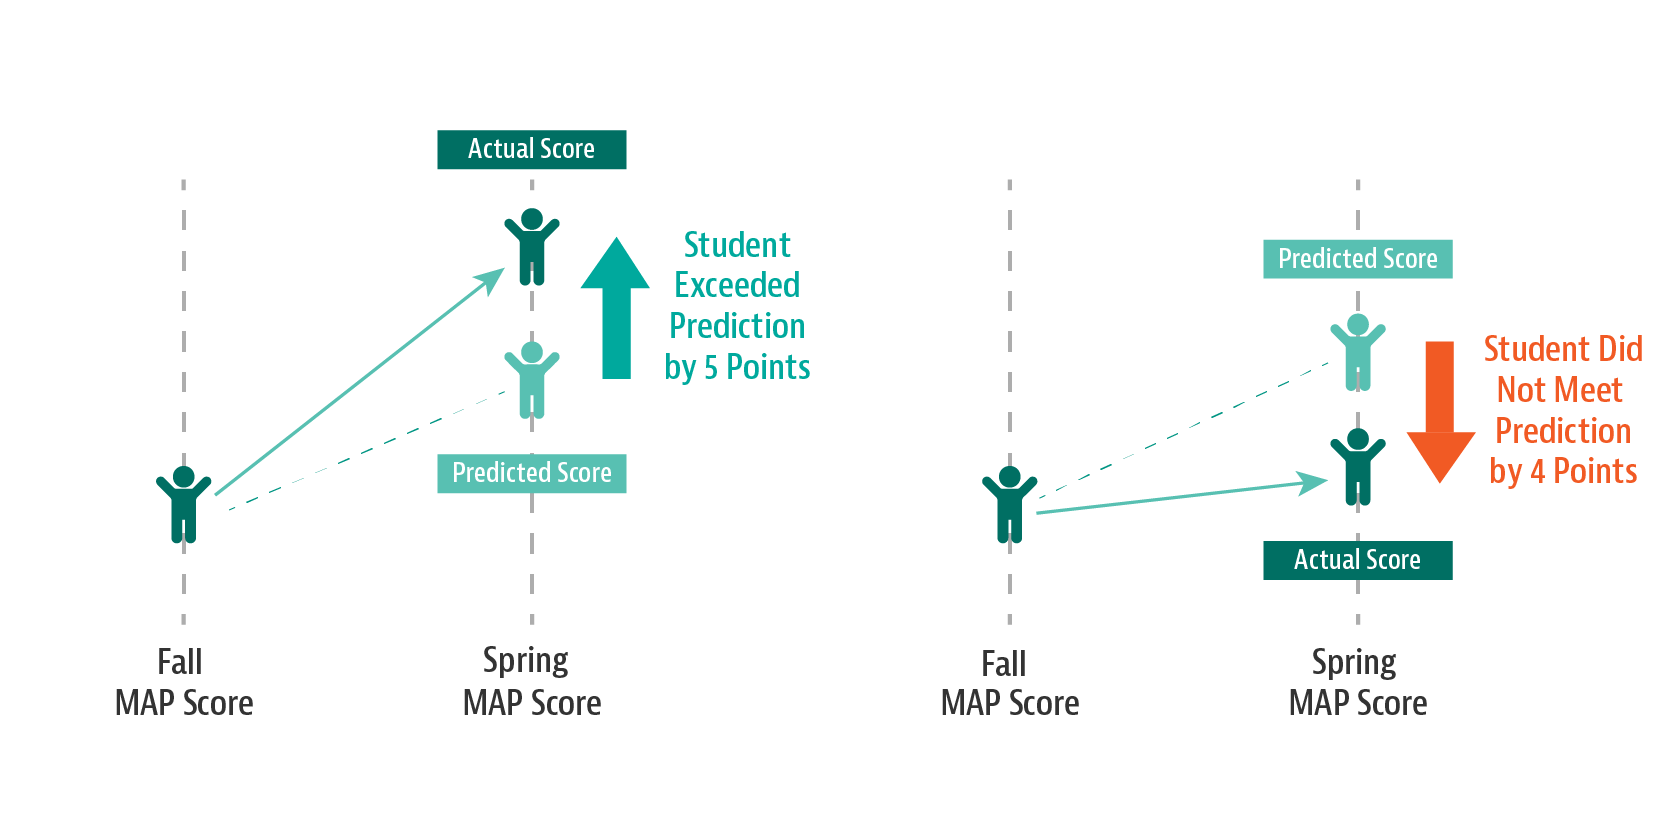
Step 3: Compare Actual Scores to Predicted Scores
Determine whether each student exceeded or did not meet prediction, and by how much.
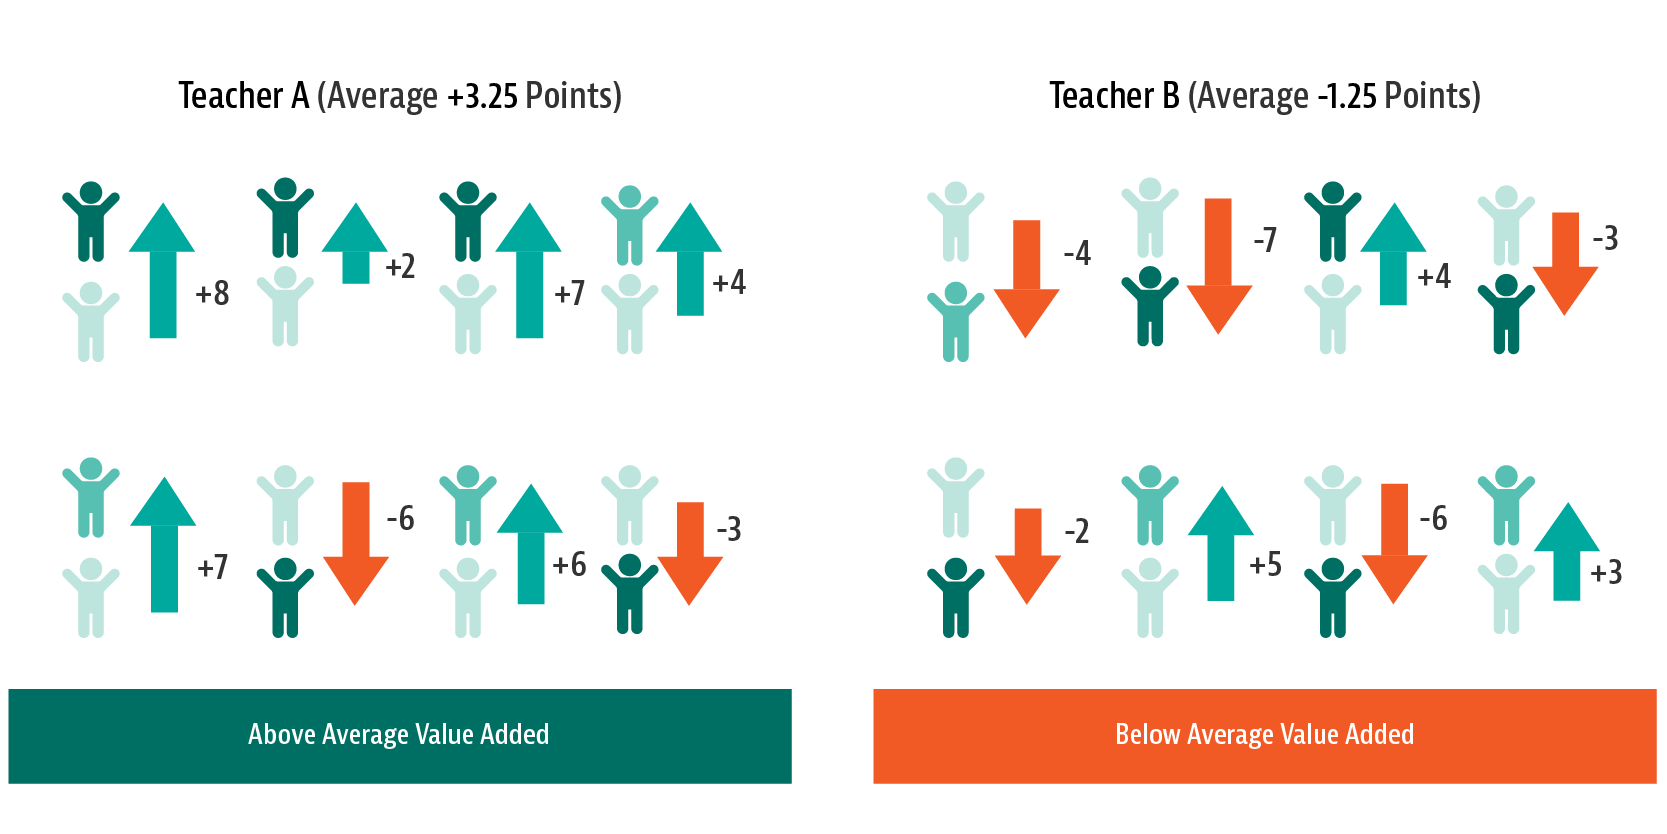
Step 4: Determine Average Growth in Teachers' Classrooms
Once individual student results are determined, we can then determine if, on average, the teacher’s students exceeded or failed to meet their predicted scores and by how much. This tells us how much “value” the teacher “added” to their students’ growth.
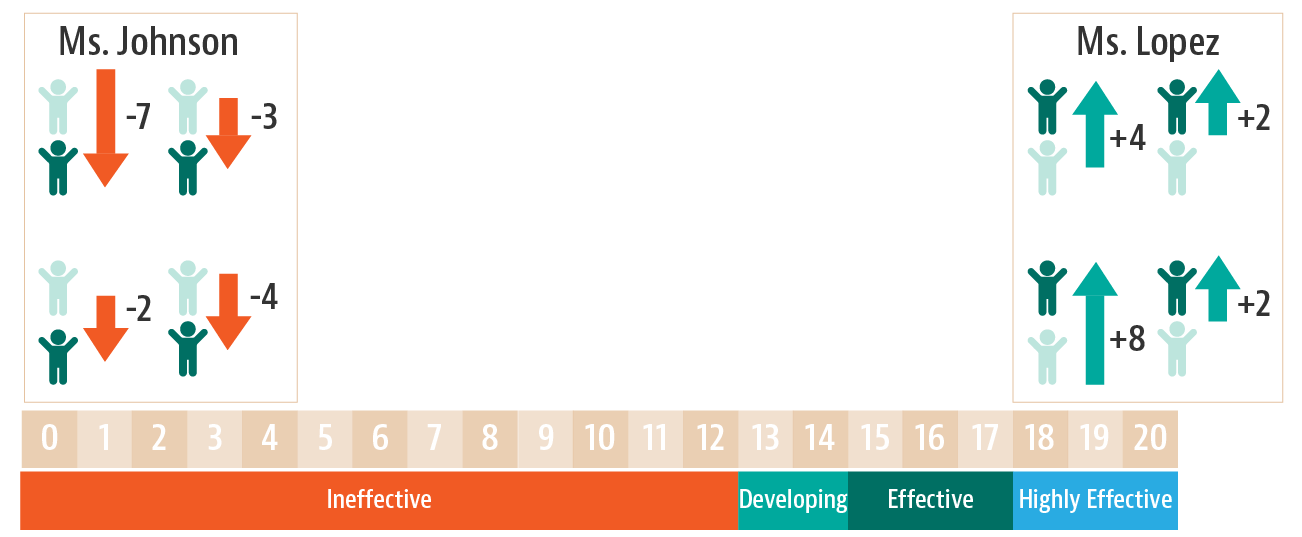
Step 5: Convert Results to the 0-20 Scale
Teacher growth model results are converted to a 0-20 scale for APPR using the NY Advisory Council’s default translation.
Example of low and high growth: Ms. Johnson’s students are not meeting their predictions by a wide margin, which means she would receive an APPR rating low in the scale. Ms. Lopez's students are beating their predictions by a wide margin, which means she would receive an APPR rating high in the scale.
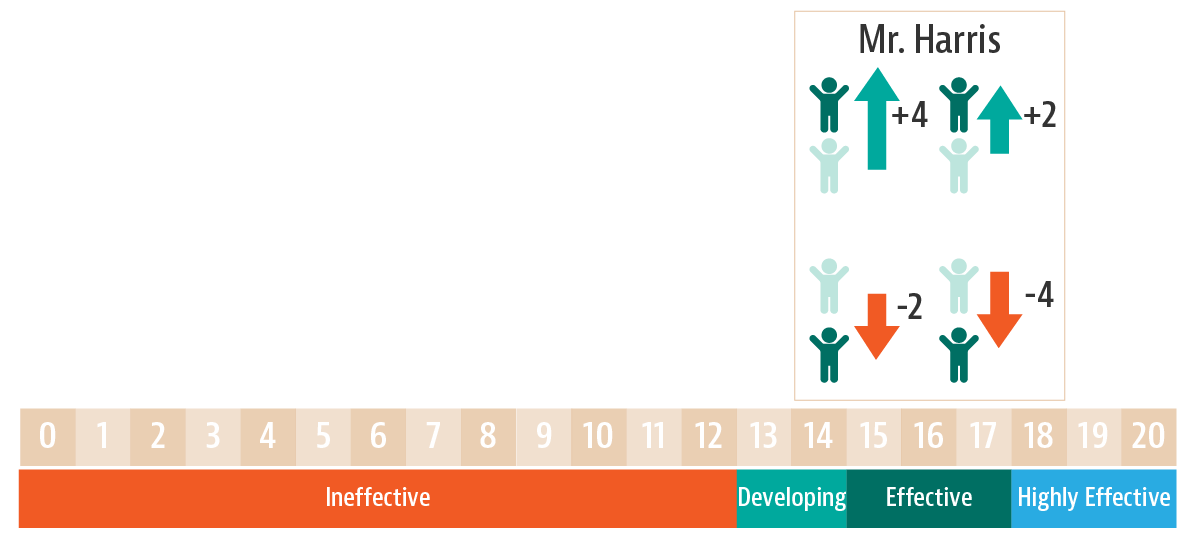
Example of typical growth: Mr. Harris’s students on average grew the same amount as similar students across the participating districts. He would receive a 16, an APPR score middle of the effective range.
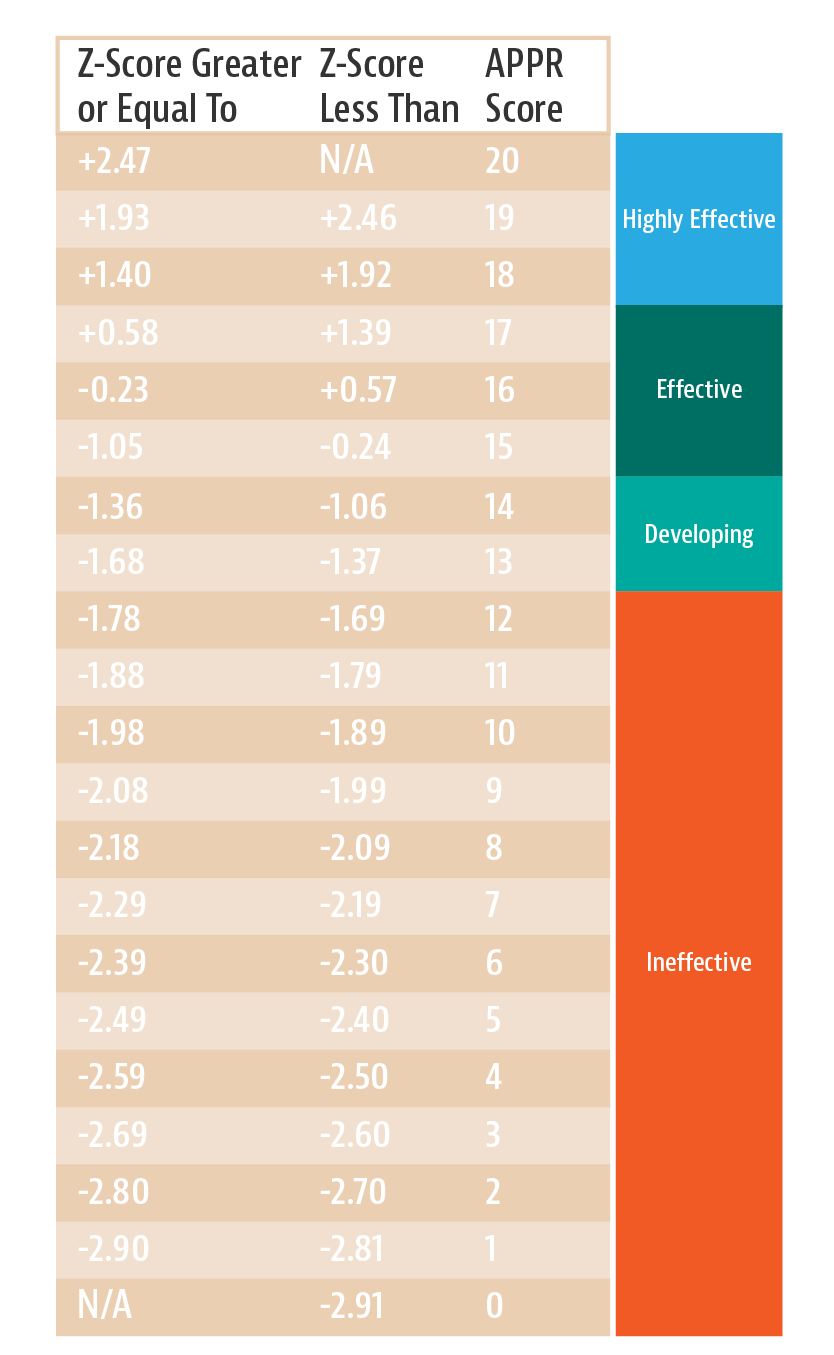
The conversion scale: EA’s growth model produces estimates of teacher and school effects in z-score units. These z-score results are converted to a 0-20 scale for APPR using the NY Advisory Council’s default translation (see growth model translation table below).
For more information about our growth model, we created two videos that outline the process for our value-added analysis as well as answer some frequently asked questions:
Video 1: Introduction to Value-Added Analysis
Video 2: Frequently Asked Questions
Questions?
For more information or specific questions about EA’s growth model, please contact us at newyorkappr@edanalytics.org